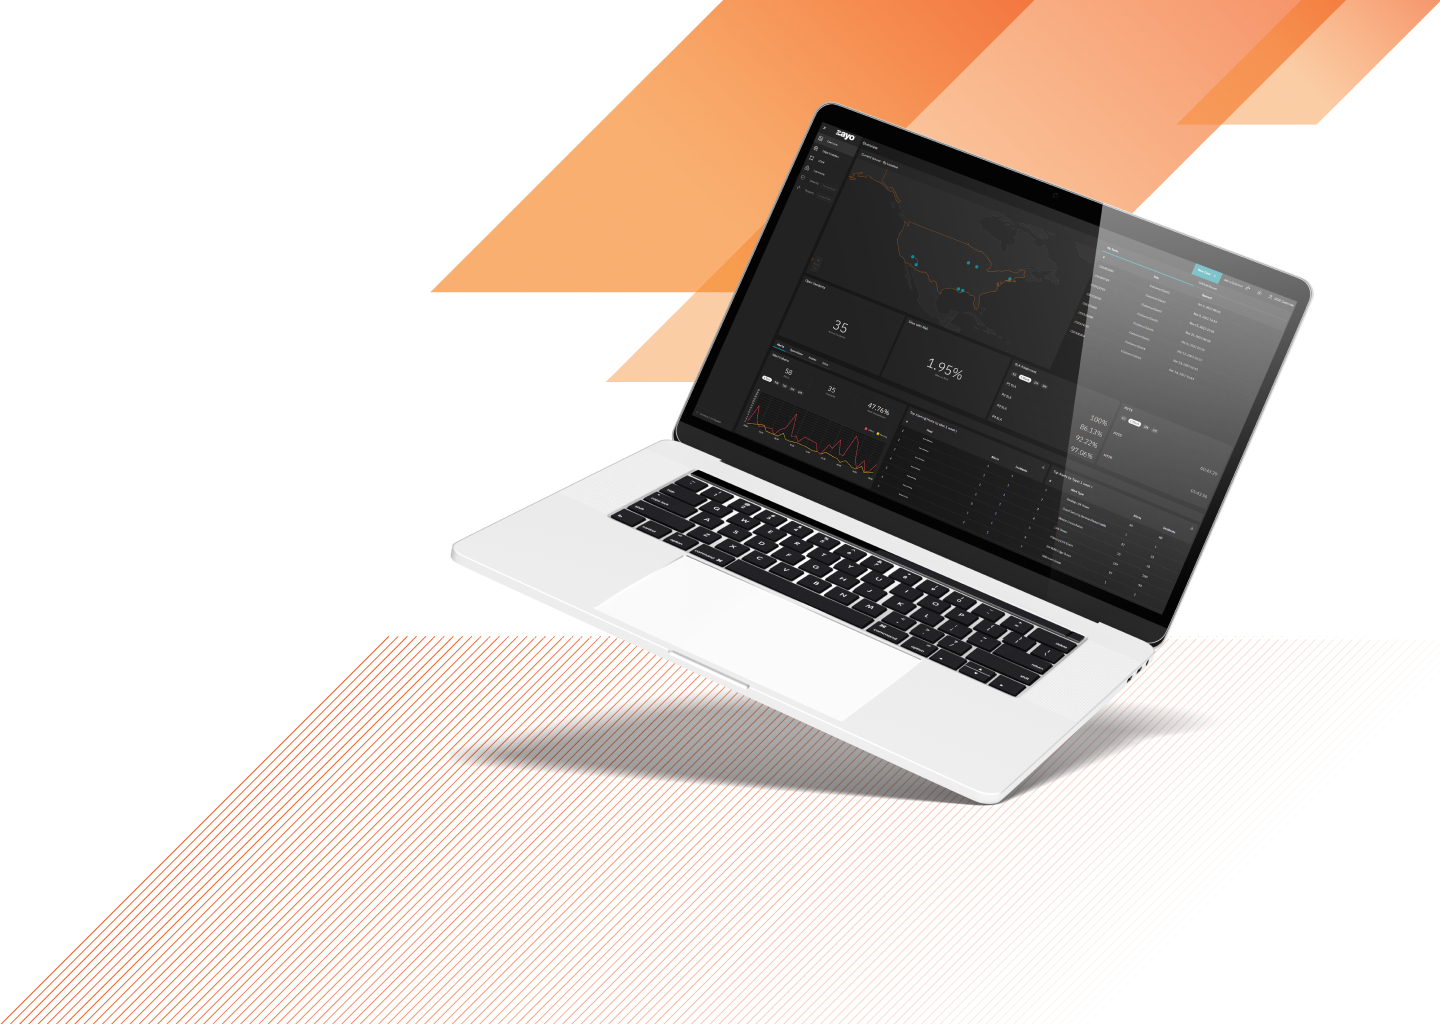
Overview
The overview is a “single-pane-of-glass” view into your network. Our AIOps platform enriches, correlates, and compresses incidents and information from across the network into a display that gives the ultimate visibility into network health, performance, and maintenance activity. With data views sorted by various axis, including time, you get long and short-term views to understand urgent issues and trends that point to a problem down the line.
Edge Analytics
This is the wide view of the network. Beyond what you see in the overview, this section gives visibility into the network’s health from an SD-WAN perspective, or simply a quick overview of things going on in the network.
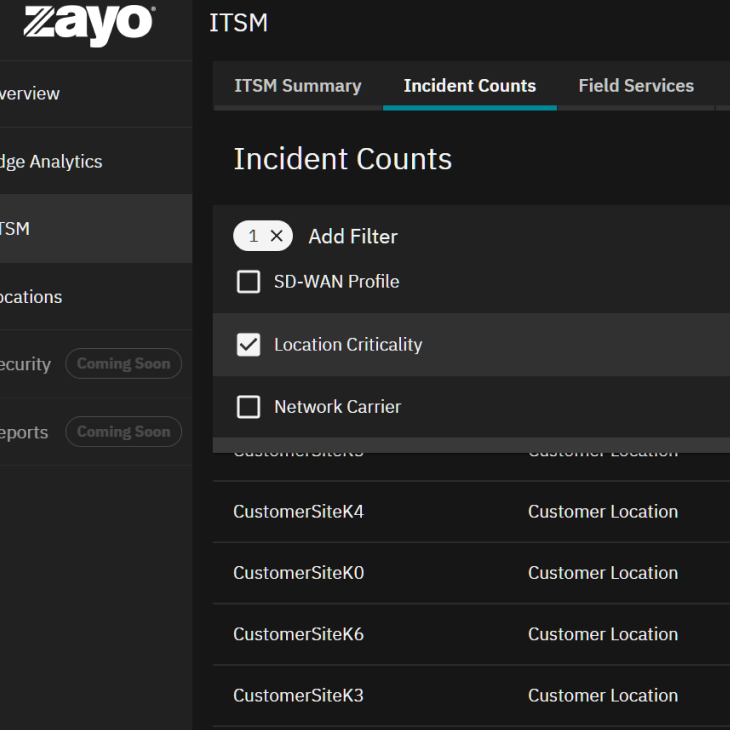
ITSM
Users can use the ITSM tab to look at incidents across the network, learn how they relate to the network telemetry that they are seeing, and determine how it relates to the operations being performed. It’s powerful visibility to see what’s happening from an operational, service, and repair perspective.
Locations
This is a tighter view of what’s happening at a specific location. Here, the compressed incidents are organized to help you understand what actions you need to take at a given site.
Alerts
Using our AIOps platform, we display alerts from multiple sources throughout the system. zInsights gathers data from webhooks, push messages from different network sources, SNMP, traditional polling-based network telemetry, APIs, syslog, and other secondary and tertiary monitoring protocols. Between those several protocols, we generate events displayed as alerts. The overview gives a snapshot of alerts by volume, site, and type.
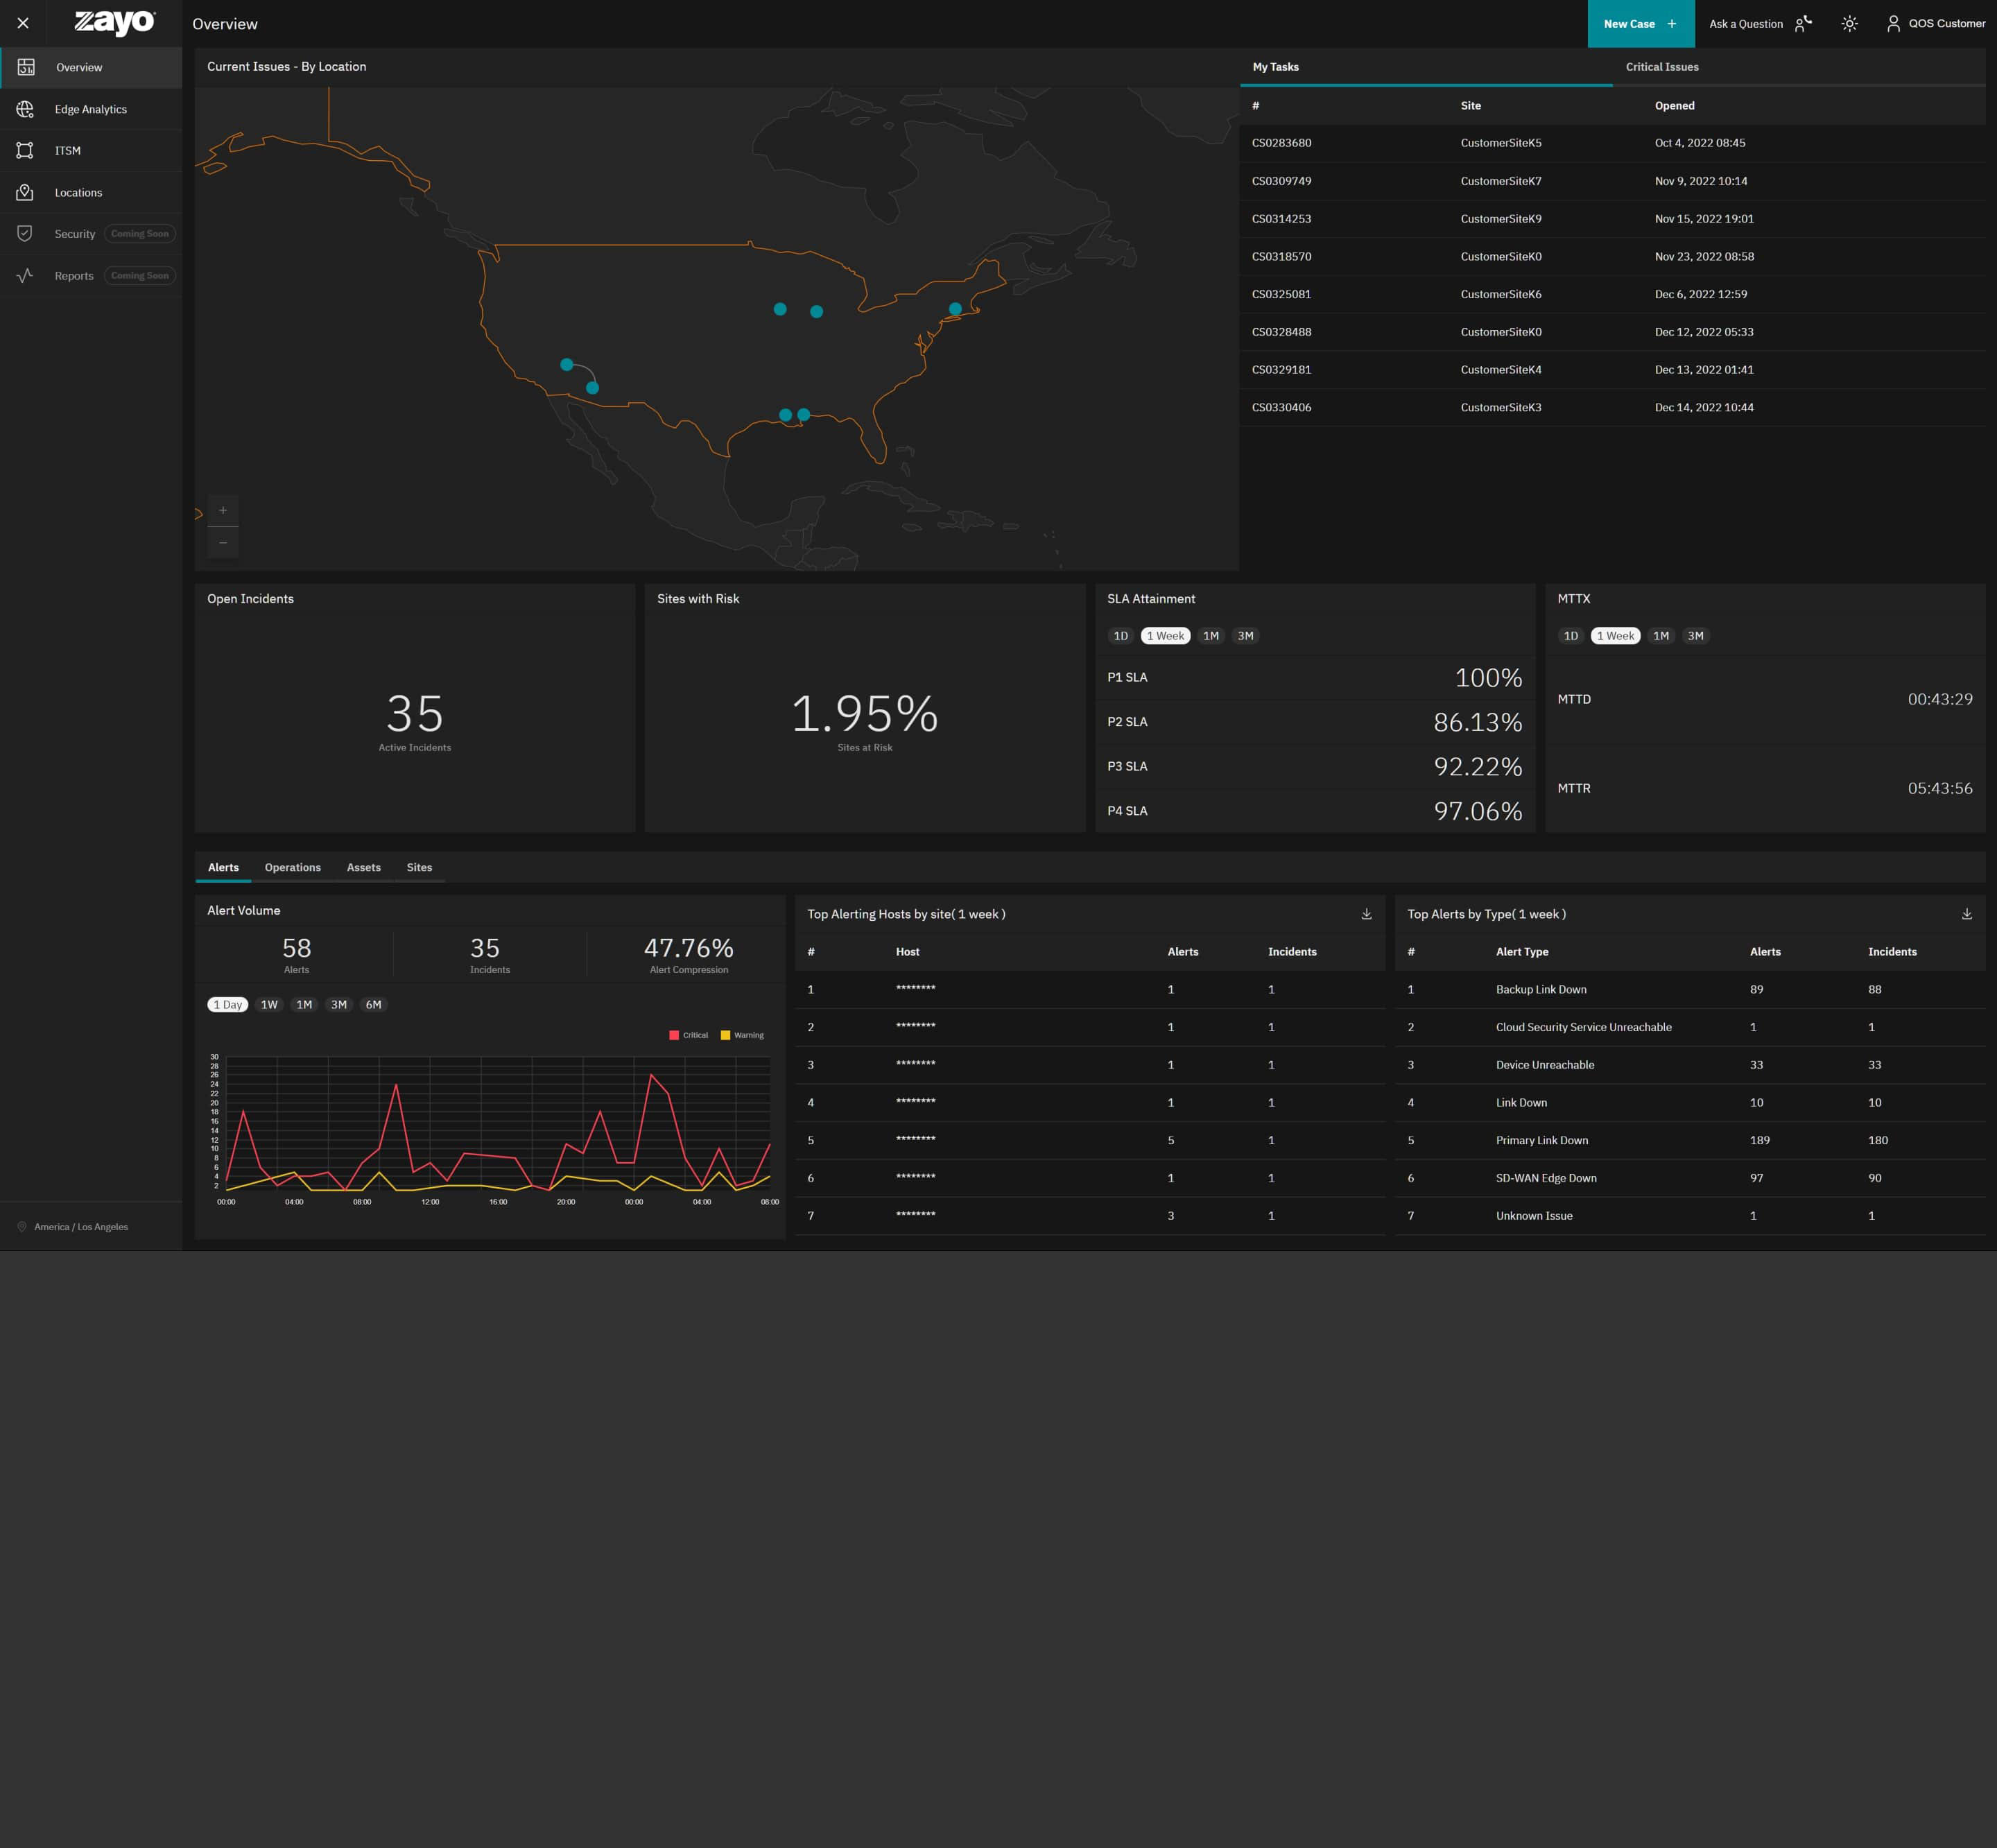
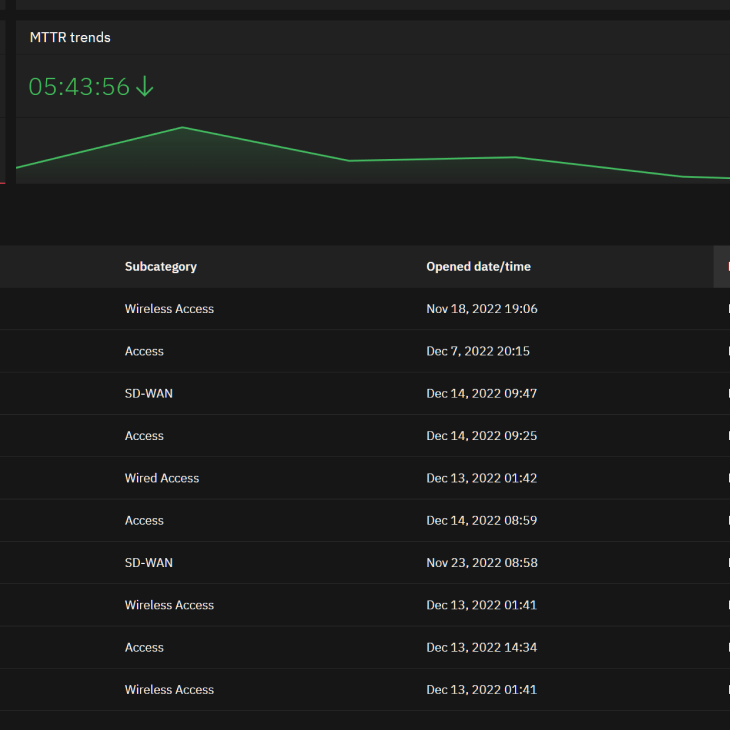
Ops
The Operations view shows different incident trends. This allows a user to look at trends in MTTD, MTTR, as well as incidents, and break them out by priority.
Sites
Sometimes you need more detail about current issues affecting a given network. The Sites tab shows more detail when looking at a given site. Here you can quickly understand things like: Is the SD-WAN Edge stable? Do we have a high level of quality on the link? Are both links active? Do we have secondary services?
New Case
Users can create a new case or ask a question to our network team or our CSAT team at any time. Creating a case allows the customer to report a network issue, request a service change or configuration change, or contact our teams to administer their account.
Location Map
In this map view, here we show a global map view of any current issues in the network requiring customer attention. Any Priority 1 issues that are affecting multiple sites or 10% of the network will be surfaced on the map here.
Open Incidents
This is a quick, high level view of sites with incidents. Here we get an overall picture of incidents across the network.
Sites with Risk
Sites with risk display anything with an open alert or an incident less than Priority 2. Something is affecting the site but is not currently causing site degradation.
SLA Attainment
Having your service available 24/7 is important and we want you to know how we are doing up front and center! This measures our SLAs for services and represents our initial follow-up to an incident as well as our response rate within the system. The idea is to be able to look at the SLAs over time, and collaborate with our NOC and our technical service managers to understand if we are doing a good job of managing the network. Detailed descriptions of the service level agreement can be found in the Statement of Work.
MTTX
Here we can see our Mean-Time-to-Detect and Mean-Time-to-Respond across different time periods across incidents. Similar to SLA Attainment, we use this to understand how we’re doing in our ability to manage the network and where we might find areas to improve.